MN505 Epidemiology – Health Statistics and Populations Chart
MN505 Epidemiology – Health Statistics and Populations Chart
The following website will aid you in completing this Assignment:
Agency for Healthcare Research and Quality [AHRQ]. (2014). Guide to clinical preventive services. Retrieved from https://www.ahrq.gov/professionals/clinicians-providers/guidelines-recommendations/guide/index.html
Directions
Once you open link it should be in section 2,
You will need to create a chart that illustrates Adult screenings, Grades A, and B: preventative care measures for individuals ranging from age 21–65.
You do not have to include Grade C, pregnancy recommendations or pediatric recommendations. You should not include Grade D or I.
The chart should include:
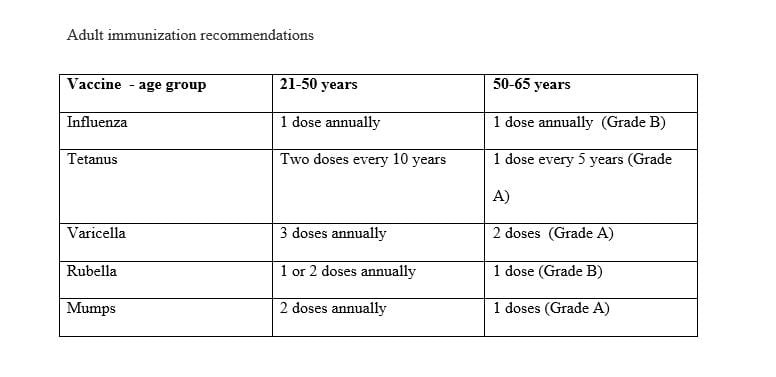
Adult Immunization recommendations
Well person visit recommendations- be sure to break this out clearly as to what is being screened at the well visits.
Prevention counseling
Cancer screening recommendations (cervical, breast, colon, lung) Other preventative services (dental care, vision care)
There should be sufficient information as to what the screening is. Look up examples of prevention guideline charts to help you get some ideas. Be sure your content and information is current per the required source above and is not content based on examples that you may find for ideas on design alone. These may be outdated.
Please include gender and age groups in your chart data. There is no narrative. This assignment consists of a title page, a chart and a reference page.
DUE: to Dropbox on end of Day 7 of Unit 10.
To view the Grading Rubric for this Assignment, please visit the Grading Rubrics section of the Course Home.
How to Submit:
When you are ready to submit your Assignment, select the unit Dropbox and then attach your file. Make sure to save a copy of the Assignment you submit.
Answer Preview to MN505 Epidemiology – Health Statistics and Populations Chart
APA
566 words