Use statistical software to create, interpret, and analyze two histograms
Use statistical software to create, interpret, and analyze two histograms in a Word document.
1. Provide histograms for lower division students and upper division students.
2Below the output, provide an accurate interpretation of histograms for lower division students and upper division students.
3Provide a descriptive statistics table.
4.Below the output, report descriptive statistics and interpret skew and kurtosis values.
The following statistical analysis software is required to complete your assessments in this course:
Jeffreys’s Amazing Statistics Program (JASP).
example
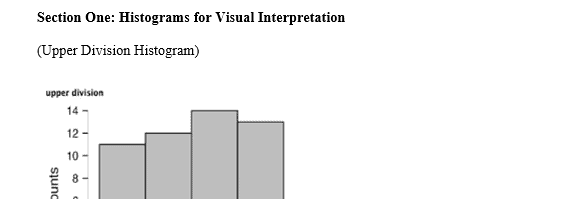
Section 1: Histograms for Visual Interpretation
Using the final and lowup variables in your grades.jasp data set, create two histograms and paste them into your Word document:
Variable Definition
Lowup lower division =1; Upper division =2
Final Final exam: number of correct answers
Variables and Definitions
Create:
A histogram for lower division.
A histogram for upper division.
Briefly describe what a visual inspection of this output tells you about the shape of the distributions.
Section 2: Calculate Measures of Central Tendency and Dispersion
Using the grades.jasp file, compute descriptive statistics, including mean, standard deviation, skewness, and kurtosis for gpa and quiz3.
Variable Definition
GPA Previous grade point average
Quiz3 Quiz 3: number of correct answers
Variables and Definitions
Create a descriptives table and paste it into your Word document.
Under the table:
Report the mean, standard deviation, skewness, and kurtosis for GPA and quiz3.
Briefly describe what skewness and kurtosis tell you about these data with regard to normality.
Submit both sections of your assessment as an attached Word document.
Paper Format: APA
Answer preview to Use statistical software to create, interpret, and analyze two histograms
APA
446 words