Data Utilization and Presentation
Assignment Details: Data Utilization and Presentation
Your CEO wants to review the benchmarking data used to compare Choice Hospital with other hospitals in the same geographic regions. The Board of Directors is looking at expanding the Emergency Department or adding more in-patient beds. The CEO needs to know how Choice Hospital compares with other hospitals in the region to be part of the decisions on expansion in these areas.
As you assume the role of the HCU at Choice Hospital, provide the data and analysis requested by your CEO as described below. In this exercise, assume that Choice Hospital is in Colorado and use the data provided by the Colorado Hospital Association for Colorado hospitals. If you wish to find data for your own state of residence, you may do that and start your search at your state’s Department of Health Web Site.
For comparison of Choice Hospital to others in the state of Colorado of comparable size you will use the specific data points requested, perform the calculations, and prepare the presentation of the data as follows.
1. You will first review the data available and summarize the data points as specified for this presentation by placing them in an Excel spreadsheet.
2. Calculate descriptive statistics for the data, as specified below.
3. Prepare an Excel spreadsheet of the data
4. The tables below include data for Choice Hospital
5. From these data calculate the average length of stay (ALOS) for Choice Hospital.
Now look at the data for Colorado Hospital at the link provided. Choice Hospital is a 300-bed facility that has between 200 and 400 licensed beds. Those are the hospitals that you will use for your comparison to Choice Hospital. In your Excel spreadsheet, do the following:
1. List the hospitals that have 200-400 licensed beds in the first column, which 1 hospital listed per row.
2. Next, for each of those hospitals enter the data in separate columns for Total Patient Days and Total Discharges.
3. In the next column, enter your calculation for ALOS using the data for Total Patient Days and Total Discharges.
*At the bottom of the column for ALOS, calculate the mean and standard deviation for the average length of stay for all of the hospitals.
*Enter the mean and standard deviation in the cell below in that column, and be sure to identify which value is the mean and which is the standard deviation.
You will submit your Excel spreadsheet along with your 600-800 word summary.
Now that you have the data on ALOS for comparison hospitals write 600-800 word summary, not including the title page or reference page and discuss the following:
* Consider the average length of stay for Choice Hospital that you calculated using the data for Choice Hospital. How does that compare to the ALOS on average for the hospitals in Colorado with similar numbers of licensed beds from your calculation?
* Identify the range of ALOS for the hospitals and consider the standard deviation value.
* Did you calcutae the standard deviation of a sample of the entire population?
* What is the difference?
* Explain why you chose the one that you did.
* Research the ALOS for the U.S. and find statistics that are within the last 5 years. The ALOS may be an overall average or based on the number of beds.
* State the ALOS for the U.S. that you found in your research, and be sure to cite the reference source.
* How does the ALOS for Choice Hospital compare to the national average?
Please submit both your Excel spreadsheet and your paper.
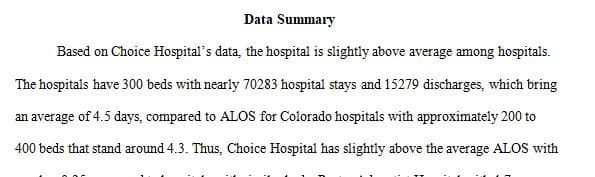
Answer preview to Data Utilization and Presentation
APA
705 words