Accurately articulates the data analysis plan.
1. Accurately articulates the data analysis plan. Ensures the plan is well justified, logical, and thorough.
2 Accurately analyzes and thoroughly evaluates and assesses statistical assumptions.
3 Accurately interprets statistical results and hypotheses, and ensures the results are thoroughly evaluated and assessed.
4 Ensures the statistical conclusions, the limitations of the test, and/or possible alternative explanations are logical and thoroughly evaluated.
5 Thoroughly evaluates potential applications of the test in the field and their implications.
For this assessment, you will use the Data Analysis and Application template (DAA Template [DOCX]) located in the files
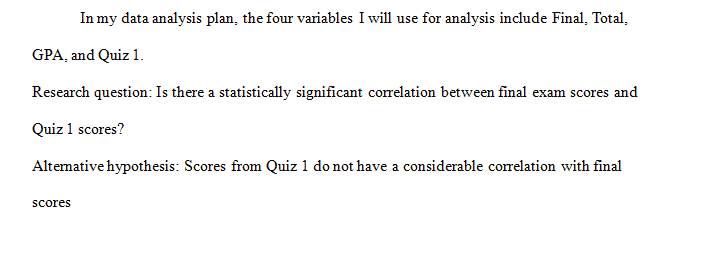
example
Variables and Definitions
The DAA Template [DOCX] has five sections:
Data Analysis Plan.
Testing Assumptions.
Results & Interpretation.
Statistical Conclusions.
Application.
Step 1: Write Section 1 of the DAA: Data Analysis Plan
Name the four variables used in this analysis and whether they are categorical or continuous.
State a research question, null hypothesis, and alternate hypothesis for the total-final correlation.
State a research question, null hypothesis, and alternate hypothesis for the gpa-quiz1 correlation.
Step 2: Write Section 2 of the DAA: Testing Assumptions
Test for one of the assumptions of correlation—normality.
Create a descriptive statistics table in the statistical software to assess normality. This table should include the four variables named above including skew and kurtosis for each variable.
Paste the table in the DAA template.
Interpret the skewness and kurtosis values and determine whether the assumption of normality was violated or not violated.
Step 3: Write Section 3 of the DAA: Results & Interpretation
Using the statistical software, paste the intercorrelation matrix for the four variables into the document.
Below the output, first report the total-final correlation including degrees of freedom, correlation coefficient, and p value. Specify whether or not to reject the null hypothesis for this correlation.
Second, report the gpa-quiz1 correlation including degrees of freedom, correlation coefficient, and p value. Specify whether or not to reject the null hypothesis for this correlation.
Step 4: Write Section 4 of the DAA: Statistical Conclusions
Provide a brief summary of your analysis and the conclusions drawn about correlations.
Analyze the limitations of the statistical test and/or possible alternative explanations for your results.
Step 5: Write Section 5 of the DAA: Application
Analyze how you might use correlations in your field of study.
Name two variables that would work for such an analysis and why studying the relationship may be important to the field or practice.
Submit your completed DAA Template as an attached Word document in the assessment area.
The following statistical analysis software is required to complete your assessments in this course:
Jeffreys’s Amazing Statistics Program (JASP).
Paper Format: APA
Answer preview to Accurately articulates the data analysis plan.
APA
968 words
Get instant access to the full solution from yourhomeworksolutions by clicking the purchase button below