Statistics for Managers Using Microsoft Excel
- Complete the Chapter 1 and Chapter 2 problems listed below.
- Chapter Review Problems (Statistics for Managers Using Microsoft Excel):
- Chapter 1, Problems 1.50, 1.51, 1.52
- Chapter 2, Problems 2.89, 2.90, 2.92
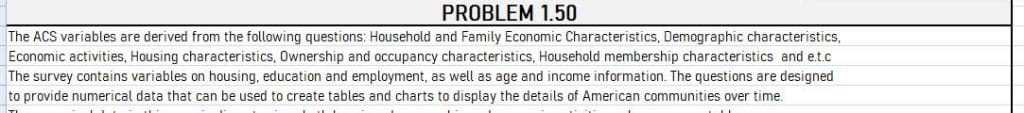
- Problem1.50 :: The American Community Survey (www.census.gov/acs) provides data every year about communities in the United States. Addresses are randomly selected and respondents are required to supply answers to a series of questions.
Describe a variable for which data are collected.Is the variable categorical or numerical?
If the variable is numerical, is it discrete or continuous?
Problem 1.51 :: Examine Zarca Interactive’s “Sample Employee Satisfaction Survey/Sample Questions for Employee Satisfaction Survey,” available at bit.ly/21qjI6F.
Give an example of a categorical variable included in the survey.
Give an example of a numerical variable included in the survey.
Problem 1.52 ::Examine Zarca Interactive’s “Sample Employee Satisfaction Survey/Sample Questions for Employee Satisfaction Survey,” available at bit.ly/21qjI6F.
Give an example of a categorical variable included in the survey.
Give an example of a numerical variable included in the survey.
Problem 2.89 ::The following table stored in Movie Types represents the market share (in number of movies, gross in millions of dollars, and millions of tickets sold) of each type of movie in 2018:
Type Number Gross ($millions) Tickets (millions)
Original screen play 306 3977.5 443.4
Based on fiction book or short story ?94 2528.7 281.9
Based on comic or graphic novel ?15 2328.5 259.6
Based on real life event 209 ?841.5 ?93.8
Spin-off ?4 ?701.4 ?78.2
Based on TV ?5 ?436.4 ?48.7
Based on factual book or article 23 ?364.7 ?40.7
Remake 10 ?322.4 ?35.9
Based on game ?2 ?159.3 ?17.8
Based on folk tale, legend, or fairytale
?7 ?158.0 ?17.6
Source: Data Extracted from www.the-numbers.com/market/2018/summary.
Construct a bar chart, a pie chart, a doughnut chart, and a Pareto chart for the number of movies, gross (in $millions), and number of tickets sold (in millions).
What conclusions can you reach about the market shares of the different types of movies in 2018?
Problem 2.90:: B2B marketers in North America were surveyed about content marketing usage, organization, and success. Content marketers were asked about how content marketing is structured within their organization and how they would describe their organization\’s commitment to content marketing. The tables in this problem stored in B2B summarize the survey results.
B2B Content Marketing Organizational Structure Percentage
Centralized content marketing group 24%
Each brand has own content marketing group 5%
Both: centralized team and individual teams 13%
Small marketing/content marketing team 55%
Other 3%
Source: Data extracted from bit.ly/2d98EaN.
Construct a bar chart, a pie or doughnut chart, and a Pareto chart for this table.
Which graphical method do you think is best for portraying this table data?
Commitment to Content Marketing Percentage
Very/Extremely Committed 63%
Somewhat Committed 30%
Not Very/Not at All Important 7%
Source: Data extracted from bit.ly/2d98EaN.
Construct a bar chart, a pie or doughnut chart, and a Pareto chart for this table.
Which graphical method do you think is best for portraying this table data?
Problem 2.92:: Based on the two tables, what conclusions can you reach concerning marketer\’s perspective on content marketing? Suppose that the owner of the restaurant in Problem 2.91 also wants to study the demand for dessert during the same time period. She decides that in addition to studying whether a dessert was ordered, she will also study the gender of the individual and whether a beef entrée was ordered. Data were collected from 630 customers and organized in the following contingency tables:
GENDER
DESSERT ORDERED Male Female Total
Yes 96 50 146
No 234 250 484
Total 330 300 630
BEEF ENTRÉE
DESSERT ORDERED Yes No Total
Yes 74 68 142
No 113 375 488
Total 187 443 630
For each of the two contingency tables, construct contingency tables of row percentages, column percentages, and total percentages.
Which type of percentage (row, column, or total) do you think is most informative for each gender? For beef entrée? Explain.
What conclusions concerning the pattern of dessert ordering can the restaurant owner reach?
- Requirements: Submit your work in Word and/or Excel format, as necessary.
- Book: Required:Levine, D. M., Szabat, K. A., & Stephan, D. (2021). Statistics for managers using MicrosoftExcel. Pearson.ISBN-13: 9780135969854 (print)9780135969892 (e-text)
Requirements: See problems
Answer preview to Statistics for Managers Using Microsoft Excel